Approximate words of the talk I gave at the EU datathon in November 2017.
Hi, I’m from the Open Data Institute, or ODI. I’ve been asked to do a quick talk before the next panel about “open data and advocacy”. I’ll keep it quick so you can get to the panel and the Q&A. Asking questions is much more fun than listening to a presentation 🙂
We’re a not-for-profit. We work globally, our headquarters are in the UK. We were founded 5 years ago by Sir Tim Berners-Lee, the inventor of the web, and Sir Nigel Shadbolt, an AI pioneer. Our mission is knowledge for everyone.
As you might have seen on the first slide it’s our 5th birthday this year. Yay us. So, I want to share a bit about what we’ve learned about advocacy and open data in that time.
First, let’s talk about open data. Open data is vital and incredibly important but if we only talk about and use open data then we can’t deliver our mission. Instead we work across the data spectrum.
The data spectrum is about access. Who can get to data so they can use it or share it or etcetera. Some data should be kept closed within an organisation, like sales reports. Other data should be shared: the police need to be able to see your driving licence, medical records can help with research, twitter data can help us understand how social media is impacting our societies. Lots of data should be open like bus timetables, maps and addresses.
We need to talk about and use the full spectrum of data if we were to get more open data made available so that anyone can access, use and share it.
The second lesson is about goals. Sometimes it can feel to other people like the goal of the open data movement is only to publish more open data or to put data on portals. That’s the wrong goal.
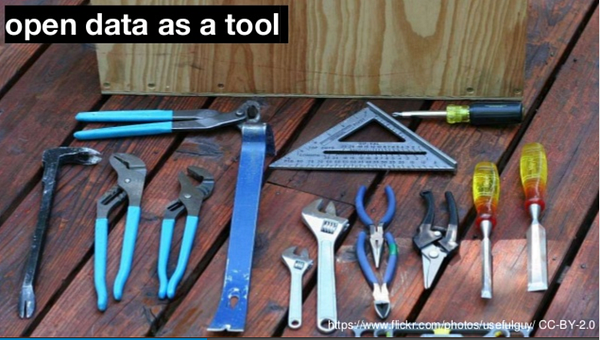
We think, talk about and use open data as a tool.
A tool that we use to solve problems. Like finding a job that you enjoy, combatting corruption, finding your way around a city, responding to the threat of anti-microbial resistance, helping with house planning and building, or understanding the growth of new sectors and business models like the sharing economy (something we’re looking at in our new R&D programme).
The third lesson is about chance. Chance is great. Very unexpected things happen when you open up data. One of my personal favourites is that the UK government opened up radar data that was originally gathered for planning flood defences and people used it to discover both new places to grow wine and new Roman roads that criss-cross parts of the country. Fantastic. But that doesn’t always work.
We need more focus on creating impact by design. Looking for problems, working with people who are experts in tackling it and getting them the data they need. To move data to the right place on the spectrum. When we do that then chance can also happen, but we also have a much higher chance of impact.
We also learnt that we need to combat the very strange view that data is oil or coal or other types of fossil fuels. I can talk in economic theory about the different qualities of data and oil, but there’s a more important difference. It creates the wrong mentality. People fight over control of oil. They want to hoard it for themselves. They want to sell it for huge amounts of money.
Instead we need to turn data into infrastructure. It is already heading in that direction but we need to strengthen that momentum. Great infrastructure is boring, reliable and safe to use. It’s there when we need it. Data is decades away from being boring, trust me *pause for ironic, self-knowing laughter*, but that’s the direction to head in. Turning data from the public and private sectors into infrastructure that underpins every sector of our economy and societies.
And that infrastructure will be built on a foundation of datasets that are made available as open data, for anyone to access, use and share. That foundation of open data makes it easier to publish and use other data. It’s a powerful way of thinking.
So those lessons are some of the ways we learnt to think — about the full spectrum of data, about data as a tool, about impact by design, and about data as infrastructure. Those mental models have helped our advocacy.
But over the last five years we have also learnt some methods that work to create impact.
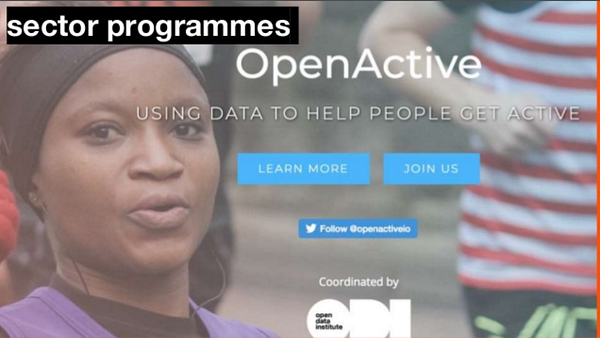
We’ve been working with whole sectors to help them use data.
The UK retail banking sector is opening up data about products, locations and cash machines and creating open APIs so that people can choose to share data held about them by banks with people that they trust. We hope it will make it easier for more people to create better services for bank customers. We’re talking to other countries on multiple continents about helping them to make the same change. GODAN (the Global Open Data for Agriculture & Nutrition) initiative that we work with is working globally to open agriculture data to solve problems.
OpenActive is opening up sport data to make people more physically active. Places that offer a whole range of sports: football, squash, badminton, table tennis, running are opening up data and they’re also building an ecosystem of organisations that will use that data to make it easier for more people to play the sports they love.
There are more sectors, like transport, coming together as they start to see the power of working together to solve common problems. We need to encourage sectors to understand and unlock the value of open data by focussing on infrastructure, skills and open innovation.
We’re launching a report next week on the grocery retail sector and GDPR based on consumer research, sector interviews and our thinking about sectors. We want to encourage the retail sector to work together to focus on opportunities, and to use the data they hold in ways that builds trust in shoppers and gives them better services.
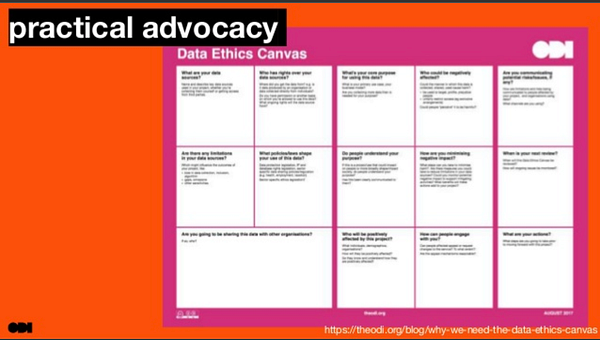
As well as sector programmes we work on practical advocacy. Here’s two examples.
A data ethics canvas to help organisations using data understand, openly debate and decide on ethical issues about collecting, sharing and using data. Interestingly when we looked at data ethics we found that most of the debate was about personal data in the closed and shared parts of the data spectrum. People had missed the ethical issues around open data.
We’ve also been working on networks. Peer networks are horizontal organisational structures with members who share similar identities, circumstances or contexts. We run global, African and European peer networks for open data and have seen their power in developing learnings and creating change. We’re learnt from how they have grown and how the people in them interact.
We’ve been seeing peer networks start to emerge in other work they do. Things like ODINE (open data incubator Europe), Datapitch (another Europe-wide startup incubator), and the sector programmes.
We believe that fostering other peer networks: in sectors, in particular disciplines (like policy), or in particular geographies will help build a better future faster. We’ve published a method report that we, or others, can use to do that.
Oh and finally, there’s another vital method. Having fun. Sometimes it can feel like things are moving slowly or in a bad direction and that things will never get better. But just as open is a political statement, we should also be aware that optimism is a political act. Having fun helps me be optimistic. Choosing to be optimistic both helps the day go faster and helps create a better future.
Thank you. I hope this talk and the rest of the event is both fun and useful.
A new report by Webroots UK on the cost of online voting in UK national elections was published last week. The report was backed by politicians from four large political parties — Labour, Conservatives, SNP and the Liberal Democrats. It is about one of our most fundamental democratic rights. It deserves debate.
The report argued that online voting would increase the number of voters and reduce costs by 26% per vote. Unfortunately it missed significant risks and argued for saving costs by making it harder for millions of mostly disadvantaged UK citizens to exercise their democratic rights. Rather than arguing to reduce the cost of democracy, we should be arguing to make it better.
The risks and decisions of online voting
One of the classic lines about online voting is that people can safely bank online so they should be able to safely vote online. An analogy that sounds useful but is unhelpful. Banking and voting are very different problems, carry different risks and societies make different decisions about them. To give three examples.
We are comfortable that banks and governments know us and can see how we spend money but want our votes to be secret. We choose to accept the risk that governments and banks might mistreat our finances, but are prepared to accept very little risk that governments and people might mistreat us because they know how we voted.The damage that could be caused is bigger and harder to undo. The risk is higher.
Meanwhile the damage caused by mistakes or manipulation of national elections is higher than in other types of election. The reward for successfully manipulating a national election will attract malicious attackers who will act for their own reasons at their chosen time.
Finally, there are risks alongside online voting. Multiple countries have seen online social media used to spread disinformation during elections. We are only just starting to understand how this happened, let alone understand the damage and what actions could reduce it. There is a risk that online voting will provide new ways for disinformation to have an impact.
These are the type of risks that people who want to introduce online voting for national elections need to consider and debate with society. We should make conscious decisions on whether or not to accept them.
4.7 million people or 15.2 million people
But even if we find an acceptable le online voting safe, or choose to accept the risks, there is another implicit argument in the report. That online voting will make it easier for up to 4.7 million people and reduce costs by making voting harder for up to 15.2 million people.
The report used a survey to argur that online voting would increase the number of voters by up to 4.7 million. These are people who do not currently go to polling stations (the places where people can vote in person) but would vote online. This would lead to a cut in administration costs by reducing the number of polling stations or reducing mailing costs by moving election material online. We will need less of these as some people vote online.
It failed to discuss how many people do rely and will continue to rely on paper voting and electoral information. As the UK’s Goverment Digital Service recently said “paper isn’t going to go away”.
A report published by the Good Things Foundation said that 15.2 million people in the UK are either non-users, or limited users of the internet, that 7.5 million of those people are under the age of 75, and that 90% of non-users can be classed as disadvantaged.
The cost reduction measures in the Webroots report will make voting harder for these millions. They will have further to travel and find it harder to get information about who to vote for.
Politics is about choices. What gets done and what does not get done. Who wins and who doesn’t. I’m surprised that politicians from these major parties appear to favour the advantaged over the disadvantaged. Why they find it appropriate to reduce the quality of service for so many.
Rather than arguing for an online service or cost reduction, argue for a better service
The Webroots report is fundamentally starting from the wrong place. It is arguing for an online service that will reduce cost, rather than arguing to improve the quality of service. Unfortunately this is a common approach when using modern technology to improve existing public services.
The UK Parliament’s new e-petitions service only offers the ability to share a petition via social media and provides no way to combine online petitions with paper petitions that are hand-signed in communities. While the logical conclusion of wanting to make elections cheaper is to simply “do less” and cancel elections. Perhaps we could use an algorithm and some data.
Doing the hard work of research and experimentation to discover how to improvr democracy using modern technology in a number of ways, as organisations like Democracy Club do, is more useful.
We will find that we can and should use modern technology to improve democracy for everyone such as through online voting, better designed forms, making it easier to find a polling station, tools to help polling station staff, and a whole host of other things that might make democracy better.
As we make those improvements we should take the opportunity to have a more informed debate over the risks and who benefits, but we shouldn’t focus solely on online services and cost reduction we should make democracy better for everyone.
Some of the changes which people have told us would make registering to vote and voting easier would cost more money. But we would like to see things changed so everyone can register to vote and vote.
As I’ve been starting to get to grips with technology policy over the last few years one of the things that has fascinated me is how little reference to history there is. When I read historical books and talk to people about technology and innovation history I find some frequent gaps. We need to learn from history if we are to make the best of the opportunity created by the current waves of innovation and technology.
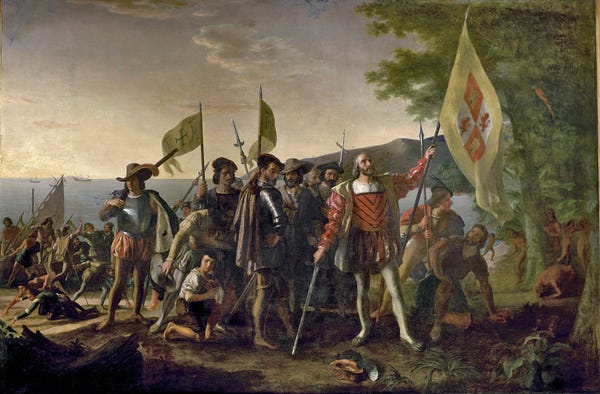
For example, people talking about the wonders of technology talk about how few staff WhatsApp had when they were bought by Facebook, yet don’t talk about how few people sailed in the Niña, the Pinta, and the Santa Maria when Columbus sailed across the Atlantic. After Columbus’ expedition more and more people crossed the Atlantic, for exploration, for business and for pleasure.
WhatsApp’s success built on the internet, the web, cryptography and smartphones. Similarly Columbus relied on inventions in navigation and shipbuilding. Neither could have achieved what they did without those previous inventions. Are they analogous?
Learning lessons from history
Recently I read a couple of books that helped me sort out some of my thinking about lessons from previous waves of technology-driven change. The books were Ruling The Waves by Deborah L. Spar and The Master Switch by Tim Wu. They are good books. If you’re interested in technology policy you should read them too. I’ll lend you my copies if you want.
Ruling The Waves uses ocean sailing, telegraph, radio, satellite television, cryptography, personal computer operating systems and digital music to explore innovation. It proposes that they show four common phases: innovation, commercialisation, creative anarchy and rules. Different actors dominate in each those phases.
There are piratical adventures in the early years before the surviving, and now dominant, winners encourage government to work with them to bring order to the new technology. Using the model of this book would show that my silly Whatsapp/Columbus analogy is fatally flawed. Columbus was in the innovation phase, Whatsapp (and other messaging services) are in either the creative anarchy or rules phase. They’re very different kinds of innovators.
Ruling the Waves argues that the eventual rules tend to be dominated by intellectual and property rights. It shows that it can take decades, or even centuries, from innovation until stable rules are in place.
The Master Switch looks at lessons from the telephone, radio, broadcast and cable television, and Apple to propose that all information technologies go through a cycle of decentralisation to centralisation ending with a corporate (or state) monopoly where innovation, the economy and consumers suffer.
It argues that a separation principle can help prevent this fate.
This principle would keep a distance between young industries and existing monopolies to enable new technologies to show their worth; between different markets to make it harder for monopolies to spread; and between the public and private sectors to prevent government from favouring friendly monopolies.
After reading the books I was more convinced than ever that the waves of change bought about by the internet and web will take decades, if not centuries, to be absorbed into our societies. It is seductive but false to think that we can legislate for technology and data quickly. We have to allow for experiments to learn the right legislative and regulatory frameworks.
Gaps in the lessons
But there were gaps in the books. That’s not unique. I see the same gaps in lots of technology policy and thinking.
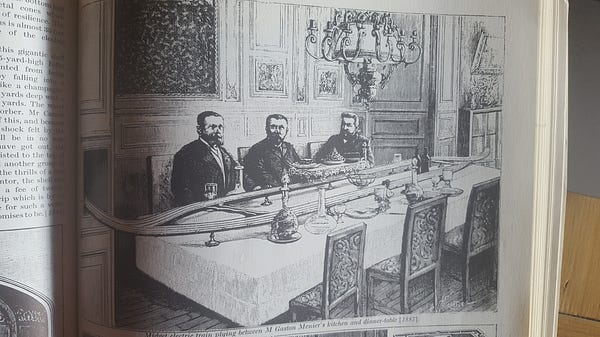
Despite the best efforts of Victorian inventors the vast majority of dinner tables do not yet feature a minature railway delivering food to bearded men. Picture from Victorian Inventions by Leonard de Vries
Major enabling waves of technology like the internet and web underpin lots of other innovation — like smartphones, social media and search engines—that each have their own journeys to go through. Some of these smaller waves will have lasting impact, some may disappear and get washed away, others are badly timed and will come back in a while. But the waves don’t stop. They are continuous. That is one of the reasons why open culture is so important. It keeps us open to innovation, new ideas and challenges from outside of a small circle of friends and organisations.
Both books miss the impact of data in the current period of change and that much of this data is personal data. It is data about you, me and billions of other people. Most data is about interactions between people, or between people and organisations staffed by other people. It is difficult, if not impossible, to determine who ‘owns’ data. For most data there will be multiple people and organisations who have rights. This makes it hard to rely on property rights as a way to shape and bring rules to the market. The challenge of building good governance for data infrastructure will need a more systemic response than property rights.
The books also focus on the US and UK, with some excursions into mainland Europe. While they describe the differences between European and US approaches to regulation, with Europe typically intervening more, I would love to see more about the lessons learned by other countries. The web, the internet and data infrastructure cross, and therefore soften, national boundaries. Learning from and listening to other countries and societies will become even more important as these waves of technology reach their full power. These excellent recent reports from the Web Foundation are useful for those in a US/UK filter bubble who want to start listening more widely.
Innovation has limits
And finally both books miss the influence of societies and people. They are books about economy, regulation and business. They miss the social side of the change.
Lots of the impact of technology is societal as well as economic. Similarly the forces that impact on and affect technology change are both societal and economic. People adapt to technology and innovation, but sometimes they push back and reject it. Those rejections can be learned from.
The innovations that led to Christopher Columbus crossing the Atlantic also led to industrialised slavery. Slavery might have helped create the modern world but it is an evil that should not have happened and should not still be happening. We could have intervened earlier and stronger to stop it. A modern world similar, but not the same as, our current one would still have been built. It would have taken longer but it would have damaged billions fewer people in the process. Our societal norms now reject slavery and many of the other things that that particular innovation enabled.
As our societies matured we embedded some of those societal norms and values into legislation. Human rights, worker’s rights, anti-discrimination, health and safety, and data protection are some obvious examples. They are strong signals from society indicating where innovation is encouraged and where it isn’t.
The precise rules will vary by country but while the boundaries of legislation will contain things that need to adapt as we learn how to do things better at the core of the legislation are societal norms and values. We cannot and should not forget our values as we go through this wave of change. Those values do change but that change should be vigorously and openly debated.
Innovation can take strange paths and be used for unintended purposes. We need to engage and work openly with societies and people if we are to both understand the limits and share the benefits of the current waves of technology.
What does this have to do with my job?
Over the last couple of years I’ve been working at the Open Data Institute where I spend about 50% of my time working with the private and public sectors delivering projects and building services. We help businesses and governments understand and adapt to the wave of change being bought about by data. The other 50% of my time is spent developing our policy thinking based on what I and the rest of the team and network learnt from delivery and research.
Clearly data is not “good” infrastructure right now, too many people can’t get the data that they need, so we think a lot about how governments and businesses can help strengthen it. We look at history when we do that. This is all part of my research. How did we recognise things becoming infrastructure in the past? How did we learn how to design and build good infrastructure? How long did it take? Do historical examples contain useful lessons?
What should I read next?
Anyway, like all of my blogs, I’m thinking out loud. These are some of the things my recent work and reading about history has made me think about. The gaps in the last two books led me to pick a book on the anthropology of roads as my next one. What should I read or who should I talk to after that?
I made a bad joke at work recently. This isn’t necessarily unusual. The reaction to this bad joke made me think a bit more than normal though.
While reviewing some research on business models I observed that most of the models were predicated on the need to increase trust between businesses and their customers.
I wondered out loud if trust was in danger of becoming the next big over-used word and idly mused that we should get ahead of the game, joking that we should think about post-trust business models.
Unfortunately I was both believed and misheard. I was believed because sometimes I sound convincing — well, I am a middle-aged white man with a beard and a convincing poker face…—I was misheard because someone thought I said post-truth business models and, without me realising it, started researching that topic.
“Post-truth” was last year’s word of the year. It even has its own wikipedia page. The Oxford dictionary describes it as:
an adjective defined as ‘relating to or denoting circumstances in which objective facts are less influential in shaping public opinion than appeals to emotion and personal belief’.
We often talk about post-truth at the Open Data Institute. We work with data after all. People ask our opinions on it. Some people tell us that better data and more facts is the answer to the challenge of “post-truth politics”. They ask us to imagine a world where someone reading a newspaper story can click on a fact to find out who produced it. And then click on the name of the fact producer to find out who funds them. And then click on the funder of the fact producer to understand their motives. This will soon cut down on those pesky emotions and bring facts back to their position of influence.
Unfortunately, there are problems with that vision.
Why and how will people click on a fact and what will they do next? We need to make it interesting for people to want to know more, to want to dive down beneath the story into the world beneath it. We need to make sure that the world beneath the story is present and linked together. We need to give people the critical thinking skills to navigate that world.
But even that risks not being enough. If you don’t believe me ask any philosophy student. One of their early courses will be on epistomology, the study of knowledge. They might be asked whether they can prove that the chair that they are sitting on is actually a chair. The students will quickly learn that for centuries, if not millenia, philosophers have been playing around with this and similar propositions.
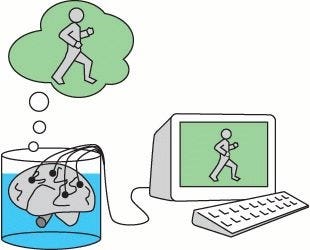
The student will be asked to prove that they can actually sense the world and experience the chair rather than it being a trick being played on them by a Cartesian demon, some controlling their brain in a vat, or — heaven forbid — someone about to be tortured by Roko’s basilisk for failing to bring about the AI singularity.
The students will soon realise that the concept of a chair can mean different things to different people and get taught that many languages and cultures don’t differentiate between blue and green. They will put up countless facts about chairs and a good philosophy lecturer will knock them all down. Minds get blown in epistomology courses.
At the end of a bewildering course the philosophy lecturer might ask their students to vote on whether they have managed to prove that their chair is a chair. Some hands will go up for no, some for yes, others might waver a bit. When my own epistomology course got to that point the lecturer held a vote and then started laughing. “Does it matter?”, he said, “is it a comfortable chair and does it stop your bum from hitting the ground? Yes? Then it’s a flipping chair.”
You see the world is already complex enough and humans can decide to make it even more complex by diving into all the facts to try to empirically prove everything. Some of us love to do that and there are times when it is both fun and important to lose ourselves in a sea of facts and data to see what we learn. There are great things out there waiting to be discovered.
But in our daily lives we often need to dive just deep enough. To not submerge ourselves in the full sea but instead to simply go to a reasonable level and form an idea that we can test. We can then hold that conclusion up to scrutiny. Perhaps by sharing it with a range of other people so that we can learn from their responses or by doing a simple experiment (did bum hit ground? No? Probably chair).
This can need some fearlessness, we have to be open to being wrong, but forming and testing ideas can often be a quicker path to a decent truth than all of the facts and data in the world. It might help stop some myths and falsehoods lasting for longer than they need to too.
Oh, and the person researching post-truth business models? They came up to me a few hours later to share what they’d learnt. I shamefully admitted my bad joke, profusely apologised for their wasted time and praised them for testing their ideas sooner rather than later…
In my job at the Open Data Institute I sometimes talk with people, from businesses and governments, about how better use of data can help them design and deliver better services. I’ve been using a public sector example recently that I’ve not written down. Here it is.
Ways to get bus timetable data to people who need it
The example I use is bus timetables. People need to know the times and routes of buses so they can make a journey and get to their destination. When I use the example I talk through four of the patterns that can be seen in many cities and towns around the world for services that get bus timetable data to people who need it.
Mass market private sector services: many cities and towns now have bus timetables available as open data. Private sector services like Google Maps, Apple Maps and CityMapper pick up this data and build it into a service which they aim at the mass market of smartphone users. The services work in many cities and might haveother features such as information about restaurants and pubs. They get their open bus timetable data either directly or through a data aggregator, like TransportAPI or ITOWorld, who collate data from multiple cities / transport providers. That takes aways some of the effort from using open data and makes it easier for more people to build services.
Targeted private/public sector services: smart cities and towns recognise that the mass market services don’t always meet all needs, particularly accessibility. If you look closely you can often find small bits of public services meeting the needs of some users, or a transport authority running a challenge to help focus the private sector market on meeting particular user needs. Left to its own devices the private sector might only target the profitable and easy-to-serve mass market, a challenge can help change that to build more accessible services or to experiment with new technologies like AI or voice interfaces. Targeted services often use the same data aggregators as the mass market services. It’s the same data, just presented for a different set of user needs.
3. LocalBusTimes: a local website and/or smartphone app where people can look up the timetables for a journey they want to make. It might be for a whole town or a single bus company. It probably started by only providing bus timetable data, nowadays I think more of them recommend a route. The local authority or bus company typically run the LocalBusTimes service themselves.
4. Physical services: not everyone has or uses a smartphone when they need bus timetable data. There are many reasons for this. To give just a few: there might be no coverage, they might not be able to afford a smartphone, they might have run out of credit/data, they might not want a smartphone, their city might not have made bus timetable data available or they might simply have run out of battery. That’s why bus stations have information desks, why bus stops have timetables printed and stuck to them and why people ask other people “when’s the next bus?” on the street. Someone has used the bus timetable data as part of the design for the bus stop or as part of designing an operational process to help a human answer another human’s questions.
Some of the reactions I get to my example
No one, yet…, has told me that my example is stupid or dull. Feel free to be first to do that.
When I talk through this example with people the usual reaction is that while lots of people knew about the transport sector and data few people had thought of all the patterns or wondered about how they could be applied to their work in another sector.
Most people had used the mass market services but very few people had thought of using the market, in this case through open data and challenges, to help them meet their own goals. Those that had thought that they risked losing control to the market and hadn’t realised that they could still discover if user needs were being met — for example through user research — and could use a variety of ways to shape the market to target unmet needs. Challenges are just one of the ways to do that. Governments can legislate. Both businesses and governments can use procurement, strike deals, make different types of data more open, either fully open or in a more controlled way through APIs, or lots of other forms of soft power to shape the market around them.
I also find that few people had thought of the physical services pattern as part of the overall service. I find that sad. It also shows that I’m in a bit of a bubble and exposed to only some views. The tech world is overly focussed on services that end in smartphones and websites. I expect/hope that’s a passing phase.
Why I’m writing this down now
I’m writing this down now because I’ve been using the example for a while. It’s good to publish it to get my thinking straight, to show some of the reactions I get and to learn from new reactions. As I often say, data is becoming infrastructure that will be as open as possible. Businesses and governemnts need to adapt to that future. They have different goals, and needs for democratic accountability, but can learn from and collaborate with each other. I’m expecting to do some more work on public sector service delivery models over the next few months. It’s good to share, even shoddy, thinking early. It’ll help make that work better.
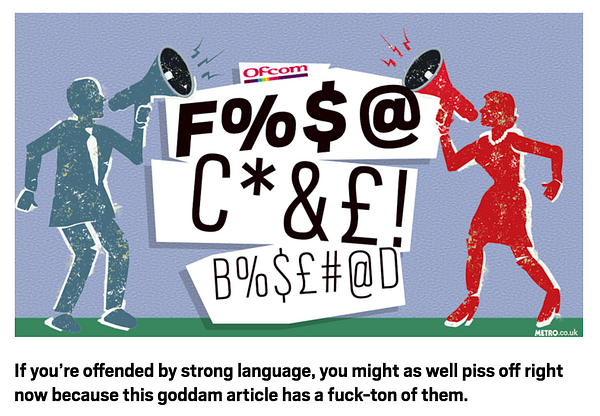
Warning: this post contains content that will be offensive to some people.
The post is a version of talk I gave at the ODIFridays series of lectures at the HQ of the Open Data Institute in London. The slides and a video of the talk are at the end of the post. Like most of my talks I adlibbed a bit. The post has links to most of the material I adlibbed from, others are at the end of the slides. It includes some thoughts on swearwords, Roger Mellie, democracy, censorship, Blackpool FC, artificial intelligence, context and an apology to my mum.
One of the UK’s regulators, Ofcom, commissioned research on offensive language last year. The research got lots of headlines. It was a nice opportunity for papers and websites to make cheap gags about swear words.
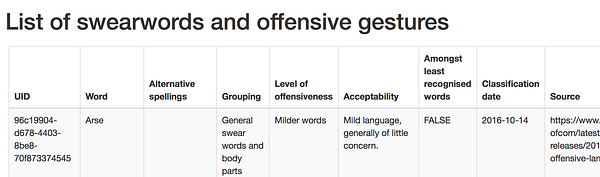
But it also gave me an opportunity to open up some swear word data and to use that example to talk with people and think about things like democracy, censorship, context and artificial intelligence. I made some cheap gags about swear words too.
After some discussion within the ODI and with Ofcom’s research team we ended up with this. The same data as the PDF but in a format that is both human and machine readable.
Now, a big part of our job at the Open Data Institute is “getting data to people who need it”. Normally I start with problems but this time I had started with data. My bad. Now to find out who needed it and how they would use it.
Some of the things people use this swear word data for
As I put the data out on twitter there was a background mantra of “arse…balls….knob…bastard…” from around the office. One person then wrote a little script that people could use to get their computers to say the list of words. Soon I could hear both human and machine voices swearing away. The swearing mantra was charming, if a little unsettling, but I had my serious face on. Why do people swear?
The main purpose of swearing is to express emotions, especially anger and frustration.
Seems fair. I suspect that a lot of people get frustrated at not being able to get data they need to do something. That explained the background mantra from the Open Data Institute office, but what about other uses of the data?
Roger Mellie, copyright Viz. Note that the swear word data might allow people to block his language, but not his gestures.
The content of the report told us about some other users. It would help TV broadcasters and presenters understand how people would react to things that they said on air and so help the presenters decide what they could say.
For example the word “bollocks” was seen as somewhat vulgar if it referred to testicles but less problematic if it was being used to call something ‘nonsense’.
This might mean that people did or did not say words in certain contexts. It might lead to some content only being accessible if a PIN was entered to unlock it.
We have given Ofcom the power to fine organisations and people that breach their codes. By publishing the report openly, they were helping broadcasters understand how they might use those powers and therefore discouraging breaches. This probably makes the system cheaper and more effective.
Broadcasters are likely to have their own guidance to help them meet the expectations of their target audiences. They could merge Ofcom’s list with their own list to help them meet both society’s needs and their own user’s needs.
Similar data is maintained in contexts outside of TV and radio
In Britain Mary Whitehouse was a famous campaigner from the 1960s to the 1980s against things that she found offensive. I can imagine Mary being keen on data-driven censorship. Image fair use via Wikipedia.
The data includes the word ginger saying it is ‘mild language, generally of little concern’, but the word ginger can also be used to describe a very tasty type of biscuit. A filter that used the swear word data to block offensive words might ban ginger nuts. That would be bad. This is a common problem with simple data-driven solutions. They ignore context.
I couldn’t find a list of offensive biscuit names but there are other sets that are similar to the swear word data used in contexts other than TV and radio.
The UK has a list of suppressed car registration plates
It is the job of part of the UK government, the DVLA, to maintain a list of combinations of letters and numbers that you cannot put on a car. Unfortunately, and curiously, the list is not published openly, but sometimes it is made available after freedom of information requests.
An extract from the suppressed car registration plate list via Whatdotheyknow
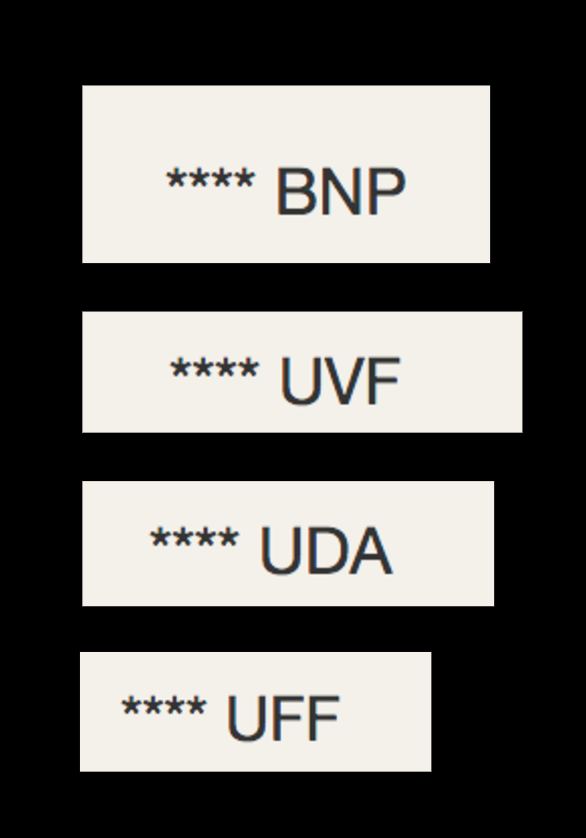
The list of suppressed car registration plates helps prevent confusion over typographically similar symbols, like o (zero) and 0 (oh). It blocks language that is likely to be considered offensive, for example “*B** UMS” and “*R**APE**”.
The list also explicitly contains the names of terrorist groups such as the UVF, UDA and UFF. Another terrorist organisation, the IRA, are already banned, like any other organisation beginning with I, because of the potential for confusion between 1 (one) and I (aye).
More controversially the acronym for the far-right British National Party, BNP, is also on the list. The BNP are allowed to stand in the UK’s democratic election process. How was that decision made? Unfortunately just as the list isn’t publicly available neither is the methodology.
Context affects what words are offensive
The UK’s democratic processes produce others lists of offensive words.
The speaker in the UK’s parliament can request that politicians withdraw words when debating with their opponents, so called unparliamentary language. The way in which words are deemed to be unparliamentary or not are unclear. In 2015 the opposition leader Ed Milliband was allowed to call the then Prime Minister David Cameron “dodgy”, yet in 2016 an opposition backbencher Dennis Skinner was asked to leave a debate because he called David Cameron “dodgy Dave”. The word “dodgy” isn’t on Ofcom’s list, it’s offensive to call an MP “dodgy” in a parliamentary debate but not to call them it on television.
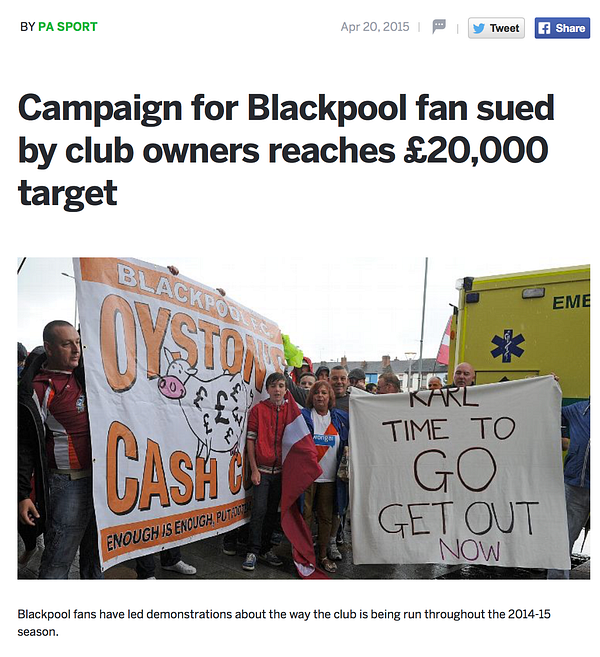
The word “Oyston” is offensive to me and my community of fans of Blackpool football club. The offensiveness is not only because of this cringeworthy picture but because of how the Oyston family treats fans.
Another example of offensive language in a particular context is the word “Oyston”.
The Oyston family own the football club that I support, Blackpool FC. Because of their actions against fans being called an Oyston fan on one of the websites used by Blackpool fans would be offensive. How would anyone outside of the community of Blackpool fans discover this?
There are related examples that may help us understand how we could do this.
Collaborative maintenance of data
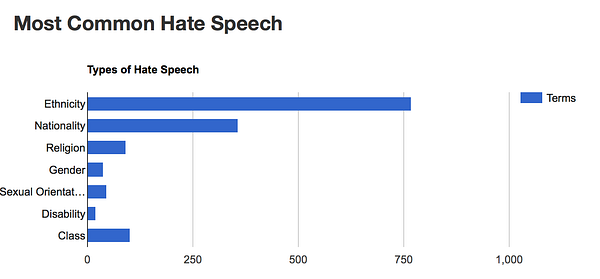
Hatebase maintains a list of hate speech from around the world. The data is maintained by automated processes and manual interaction to cater for how hate speech changes over time and in different places. Hate speech can be used to encourage violence against people and communities. The collaborative maintenance process allows people to debate which words are hate speech or not.
Other people could learn from the example of Hatebase. If British politicians wanted, and could get to grips with github, then they could collaboratively maintain my initial list of unparliamentary language and create something that would help them understand the boundaries of offensiveness.
Offensiveness is affected by time, place and communities
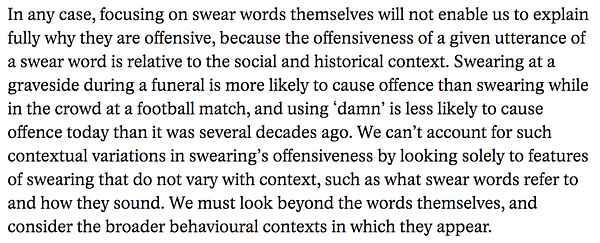
By this point in my own research I was clear that the context of offensiveness is affected by time, place and communities.
When I checked I found that swearing philosophers were, of course, already aware of this. As often happens I was a technologist rediscovering ground that others had already covered. But technology can also affect how and which words become offensive.
People create new offensive words
Oyston is an example of a word that became offensive to a small group of people before becoming offensive to a larger group. Blackpool fans have effectively used social media and the press — oh, and talks & blogposts like this ;) — as part of a campaign to get the Oyston family out of our football club. An effect of this has been to spread the understanding of the offensiveness of the Oystons from the seaside to wider parts of the footballing community. A more famous example is the case of Rick Santorum who found his surname defined as an offensive word in a campaign led by Dan Savage.
This is a challenge to any list of swear words and a risk for people who use them. People create new offensive words for their own purposes. They game systems.
Would people game the swear word data I created from Ofcom’s list? Yes, of course they would.
An example quickly came to mind. When I published the Ofcom offensive word list as open data then in line with good practice I gave every entry a universally unique identifier (UUID). UUIDs make it easier for machines to use the data.
If this data was to get widely used then how long would it be before people started to circumvent the system by being interviewed on telly wearing t-shirts with the UUID of a swear word? Perhaps over time the UUIDs, or parts of them, would become offensive? “That fella’s a right 81cb.“, they’d say. Maybe the UUIDs would need to be added to the list as they became offensive?
People adapt and change. That is one of the best things about people and one of the biggest challenges we face when maintaining and using data. We need to build in mechanisms to change datasets over time as needs and uses change.
Swear words-as-a-service is hard
It is clear that swear word data was easy to build and also clear that it would be more difficult to maintain and make it useful in multiple contexts.
I knew that many companies were already maintaining similar lists as, like many other people, I had seen, laughed and evaded filters on websites that had turned the British town of Scunthorpe into the apparently inoffensive “S***horpe” due to simplistic and bad data-driven algorithms. I do wonder how useful those filters and services are.
Many of the website filters I had seen are simple and flawed because of the lack of context and their inability to adapt to people’s changing behaviour but thinking ahead I wondered if people would start to apply machine learning / artificial intelligence (ML/AI) and create services that could automatically learn new swear words? Perhaps this could be used on a massive scale to reduce the damage caused by offensive language on the web?
I knew that I wouldn’t be the first person to think of this idea. While 2016 had been the year when every problem could be fixed with a blockchain, 2017 is the year of ML/AI.
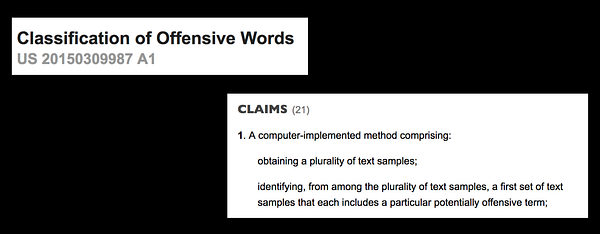
A quick search of patent libraries showed that in 2015 Google had registered a patent to classify offensive words using machine learning. Unfortunately it looks rubbish. The training mechanism worked on a large set of text samples, it failed to recognise the context in which the text was being used. The resulting service might be slightly better than current filters but would still be data-driven rather than informed by data.
Maybe, like Hatebase, it would help if users were to train the machines that provided the service. After all Google, like most other large internet companies, use thousands of people — including you — to help train their services. I started to consider what I had learn about offensive language and think of the tasks that Google would need to give to swear word raters to train their machine:
Task: go to a football ground in Gdansk, Poland. Play this video to people near you. Observe their attitude to you, and each other, over the following seven days and then categorise the offensiveness of the video. Repeat this exercise every 3 months.
Hmm… I quickly realised that this might be a Quixotic mission and that AI/ML might provide a better service but still only a partial one. There would be no perfect service. People decide what is offensive, not machines. If the service only considered some contexts then the people who controlled the machines and trained them on those contexts would be the ones who decided where it was useful. Swear word data isn’t like the location of bus stops or the list of transactions in a bank account. The context is even more important.
This is one of the challenges of the web and providing data and services for it. The web is pervasive. It interacts with the physical world in many places. It appears in multiple contexts. I use the web to watch broadcast news, like that regulated by Ofcom. I use it keep up to date on politics, where the unparliamentary rules are useful. I talk about football, and the Oystons, on message boards. I keep up to date on current affairs, and feel helpless at the levels of hate speech deployed at people in the UK and abroad. I chat to friends, both publicly on sites like Twitter and Facebook and also privately in messaging applications.
Datasets and services that reduce offensive content on the web will need to cater for all of these different contexts, and more. Even if they do, some people will still work around them. Data and technology may be able to help the problem but it will only ever be part of a solution to something that is fundamentally a more human problem. Our need to express our emotions in language.
Sorry mum
It was clear from my investigations that we could usefully create data about swear words, i.e. words that are offensive. That the need for this data came from people who swear, people who didn’t want to swear and societies & communities trying to decide the boundaries between what was offensive or not. That it would be useful if the research and rules for deciding on what was offensive were open. And that if people could collaborate to decide on what was offensive that the data would be more useful because it would cater for more contexts. But it was also clear that while technology creates new possibilities to reduce offensiveness that people will still adapt to achieve the goal they want. So it goes.
The other thing that was clear from the talk was mine and my audience’s squeamishness with some of the words. In my case it was certainly because of one of my most important contexts: my upbringing and my family. I’d like to end this post the same way I ended the talk by apologising to my mum. Sorry mum.
The questions from the audience showed the importance of context
At the end of the talk at the ODI the audience raised several points about offensive language that had not been covered in the talk, such as the use of racial and religious slurs. I was already covering a wide topic. Racial and religious offensiveness cover even more ground. I couldn’t cover everything.
Image from The Wanderers, based on a book by Richard Price. The film includes a fantastic scene in a 1960s New York school where people of different religions and ethnicity try, and fail, to remember all of the offensive names they have for each other.
I did find it interesting that the audience in the room hadn’t heard of some of the words in the list. Particularly choc ice, blood claat and bum claat, words that in my — white, middle class, mostly Northern England and South London experience — are used against black people or in black communities. In the case of the latter two more specifically within Jamaican communities.
That people hadn’t heard of these words says something about the context of the audience. A context where those words may not have been seen as offensive. Perhaps next time I talk on this topic I should try and sneak in some offensive language from different contexts to see what happens.
Watch the original talk or read the slides
If you want you can watch a recording of the talk (which includes some swear-a-long fun):
The story was full of excitement about the convenience and how cycling can help people becoming more active and improve air quality by reducing the number of car journeys. But the story also featured challenges: piles of bicycles on pavements and congested cycling lanes in cities not expecting an increase in traffic. Transport authorities seemed to be caught between the desire to seize the opportunities and head off the complaints.
But one thing that was missing from the story was how familiar the challenges are and how cities are already tackling them in other areas. At the Open Data Institute, where I work, we like to talk about design patterns for policies that use data to create impact. Some of the patterns needed to make bike sharing better are already in use elsewhere. Bike sharing companies and cities can learn some lessons from cars, buses and other cycling apps to tackle the challenges a bit faster and grab the opportunities a bit sooner.
What is bike sharing
Mobike is one of a number of firms offering bike sharing services. The service is simple. You download a smartphone app, request a bike, go to the location shown on the app, get the bike, cycle to where you want, leave the bike somewhere convenient and pay your fee.
The bike sharing operator will need to process orders and payments, maintain a fleet of bikes and predict demand so that they can move unused bikes to where they are likely to be needed.
The local transport authority has a different task. They need to maintain transport infrastructure to suit the different modes of transport (walking, cycling, cars, buses) that meet the needs of different groups of users (able-bodied people, people with disabilities, tourists, residents, business travellers) at different times of the day. It’s great that cities are welcoming trials of another option in this already complex system.
Some of bike sharing’s challenges can be helped by better use of data
Some of the challenges posed by bike sharing are already being helped by data. Better use of data can tackle them more easily.
Neither cyclists or bike sharing companies want congested cycling lanes. It will make it hard for people to get where they want and risks increasing accidents. That will reduce the number of people who cycle, and reduce the profits that bike sharing companies might make. Giving transport authorities access to data about where people cycle and where accidents occur will help them meet demand and create safer roads. Giving cyclists data about congested cycling routes will help them make better decisions about where to cycle and when.
The bike sharing companies don’t want piles of unused bikes on pavements. They make money when the bikes are used. Bike sharing companies won’t have data on how congested a pavement is because of other traffic: for example bicycles belonging to a competing bike sharing company or because of pedestrians trying to get to lunch. But that congestion can damage their reputation. Giving bike sharing companies access to this data will help them make better decisions about when to move bikes. Giving transport authorities access to this data will help them understand the impact of bike sharing on other types of transport.
Data isn’t a magic bullet. You can give better information to cyclists, bike sharing companies and transport authorities but there is no guarantee that they will use it or that they can even use it quickly. But it can help. We’ve seen it already. The transport sector still has lots to do to improve data but it is a sector which is ahead of most.
Learning the lessons
Many transport authorities already publish open data about congestion, accidents and road closures. Google, Uber and Strava are starting to publish aggregated open data about usage of their platforms for car and bicycle transport through the Mobility, Movement and Metro programmes. By making this data openly available then everyone can improve the service that is provided to car drivers, taxi passengers and cyclists. Openness is essential. It means that cyclists and taxi drivers can use a whole range of services to decide on a route while transport authorities can easily combine the data to give advice or decide where to build new capacity.
Pedestrians can report congested pavements using services like MySociety’s FixMyStreet. The reports are published openly so could be used by the bike sharing companies and transport authorities. If the bike sharing companies all publish aggregated data about where their bikes are left then the decision making can be further improved.
The challenge of bad data business models
Ah, I hear some readers say, but surely there’s a problem? If the bike sharing companies openly publish data about where their cycles are and the routes that people take then won’t that mean that other companies will use that data to compete with them?
Well yes, they may think they can sell it. But data monetisation is not a very clever strategy for these companies. That isn’t only because their users might prefer the data to be used to benefit their community but also because their users are carrying the smartphones that they used to get the bike. Google, Apple, and the telecoms operators have similar same trip data. It has negligible value.
In a world where data is abundant then data monetisation will work when you can add value to data. For example, it will work for data aggregators, like TransportAPI and ITOWorld, but only occasionally for data publishers. Instead bike sharing companies should open up the data to improve the service.
Data is not oil but it is infrastructure
In the 21st century when it is so cheap to get and use data, business models based on the scarcity of data are generally going to fail. That is one of the many reasons why “data is oil” is an utterly utterly terrible analogy. The smart bike sharing companies will open up aggregate data about usage and the locations of bicycles. They will compete on the quality of services. That competition and focus on services can benefit their users and the wider transport network.
But what happens if bike sharing companies aren’t smart? If they choose to impair the service they give to their users because of a lack of understanding of data and bad business models?
Well, that’s the final data lesson for this post. Data is a new form of infrastructure. Governments are realising that this infrastructure needs to be as open as possible, while respecting privacy, so that businesses can be built and services improved.
The UK government and local authorities tried, and failed, to persuade bus companies to open up data so are now legislating to force it to happen. That legislation will improve services for bus passengers by making it easier for services like Google Maps, Apple Maps and CityMapper to help people decide on their journey.
If the bike sharing companies don’t decide to be smart then I suspect the genuinely “smart cities” will make the decision for them. Bike sharing companies will be welcomed, but only the companies that decide to provide better services by opening up their data. Smart companies will learn the lessons and get ahead of that particular game.
If you enjoyed this story, we recommend reading our latest tech stories and trending tech stories. Until next time, don’t take the realities of the world for granted!
Next week Blackpool and Exeter will play a game of football at Wembley to decide which team gets promoted to the third division. Most Blackpool fans, including myself, will boycott the game. They will boycott because of the actions of the owners, the Oyston family, who have threatened and taken legal action against many of the club’s fans.
Football is a sport that entertains billions of people around the world. It helps brings people and communities together. Blackpool FC doesn’t. All of my family boycott the club. It is tainted by the Oystons and their actions.
A big game like this would normally be an opportunity for families and the town to unite, whether in victory or defeat. Instead this game will leave the town confused and frustrated, thinking of what could have been. Blackpool’s owners don’t get the damage that they have done to football, the town and the fans.
If you are thinking of going to Wembley then, unless you are an Exeter fan, please don’t. While if you happen to be watching or reporting on the game then it’s important that you understand the reasons for the boycott and that you tell others about it.
That way you can help support all of the Blackpool fans who are trying to heal the damage of the last few years and create a club that all of the fans can support.
This isn’t easy, it hurts
It’s hard not to go and watch your team.
I remember Brett Ormerod’s goal at the Millenium Stadium when we got promoted in 2001. I watched it with two very quiet friends who were in town to support Preston North End in their playoff final. They were even quieter when Bolton took Preston apart in their game two days later.
In 2007 I was at Wembley with my future wife and a group of friends to watch Keigan Parker’s stunning goal help Blackpool beat Yeovil at Wembley to get promoted to the Championship. We met up with a colleague from Yeovil afterwards to share memories and talk about the next season.
In 2010, when Brett Ormerod scored the winning goal to take Blackpool up to Premiership, seven of my family were in attendance along with over 36,000 other Blackpool fans.
This game will create no such memories or reunions for me or thousands of Blackpool fans. I boycott. That hurts.
I boycott because of what the Oystons have done
The Oystons have wasted the opportunity provided by a £90m windfall from Blackpool’s recent season in football’s top division. Much of that windfall has been loaned from the club to other companies. The terrible waste of that money is damaging the club but that is not the main reason I boycott.
One 67-year old Blackpool fan had to pay £20,000 for a private Facebook post seen by 34 (yes, you read that right. Thirty. Four) friends. Fans raised the money to pay the fee.
My boycott is because the Oyston family have abused fans, taunted them and taken legal action against them. An unknown number of legal actions are ongoing. These legal actions carry a large human cost.
Some individuals have lost their jobs, businesses are in jeopardy, relationships with partners have broken down and health has suffered.
That damage cannot be undone. The Oystons have to go before many fans go back.
Thousands of Blackpool fans are trying to make things better
The fans are working to get the Oystons out of the club and turn Blackpool FC into something that we can be proud of. A club that puts football first and that all fans can support.
While the Oystons remain there is an ethical boycott in place. We call it NAPM: Not A Penny More. The boycott works. The official attendance figures have dropped dramatically and overstate the actual attendance. In some games last year the actual attendance was three thousand lower than the official attendance. The Oystons listen to money. The drop in income will hurt them.
The missing fans are still there and still passionate. Six thousand people joined the most recent protest march with Blackpool fans joined by other football fans from around the country. The Blackpool Supporters Trust have offered to buy the club but the owners have refused to enter negotiations.
Some fans will recreate part of the Wembley experience by watching on a giant screen that they have hired. Others will join friends down the pub or stay at home. A few will simply ignore the game altogether, the Oyston’s actions have led to them falling out of love with the club and the game.
I know that the short-term pain of missing games is morally right, I cannot give money to a club that sues its fans. I also know that it will help get the Oystons out of the club. The declining revenues, empty seats and protests at Blackpool tell a tale. The tale of a football club whose owners are not wanted and not welcome, who are damaging the game and the town. Eventually they will run out of money or the authorities will intervene. The football league are starting to realise that their rules needs to change so that they can help address the problems at Blackpool and elsewhere.
In the meantime the best way to help Blackpool football club is to encourage people to boycott. I hope this post helps persuade some people who might be wavering and helps both journalists and oppositions fans who haven’t heard of our protests understand why Blackpool fans boycott and why that matters.
We boycott because of the actions of the Oystons. We boycott to help save the club.
I occasionally walk around, wave my arms and proclaim:
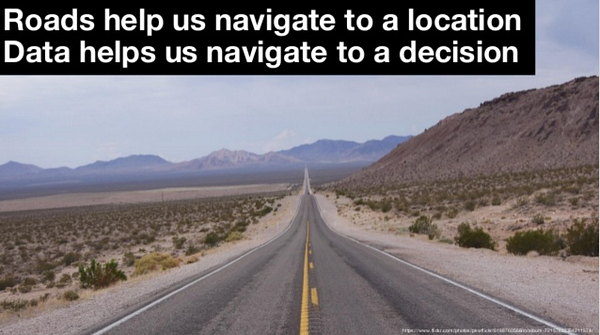
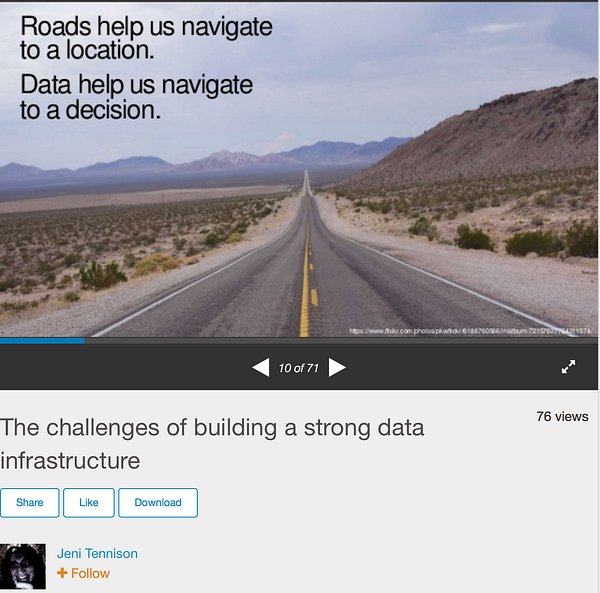
data is infrastructure, just like roads
I alternately blame and praise the brilliant Jeni Tennison for this strange affliction. I praise Jeni for coming up with the wonderful analogy of roads for data, I blame her for infecting me with the bug of excitedly talking about it to anybody and everybody so that I can learn from what they think.
I recently proclaimed that data was like roads to a friend who has a degree in classics and spent a career teaching in primary schools. She is very well-read.
My friend asked me if I thought that as a society we were well advanced in building our data infrastructure.
No, I said, it’s only been a few decades since the invention of the internet / web which led to the current massive growth in data, I suspect it will take a decade or two before we learn how to do data things well.
I think you’re right, she replied, after all the data infrastructure that you describe sounds a lot like the Roman roads and it took us a couple of millennia to start getting roads right.
Really? I said. Roman roads? That sounds interesting….
Roman roads were for the economy as well as the military
Our usual vision of a Roman road is either a muddy field being dug up by a team of archaeologists or an army of Roman soldiers marching to try and conquer a new land. But Roman roads were used by other people too. They were an important component of the Roman economy.
People transported goods along them for trade and materials for building new houses. Books have been written about the impact of roads on Roman Egypt and Italy — they had sophisticated pricing models, integrated their road with other modes of transport and they evolved governance arrangements to manage the development of their roads.
But Roman roads were not only for armies and traders. They were also used to transport messages, taxes and people. Along the cursus publicus, or public way, there were mansios, or waystations.
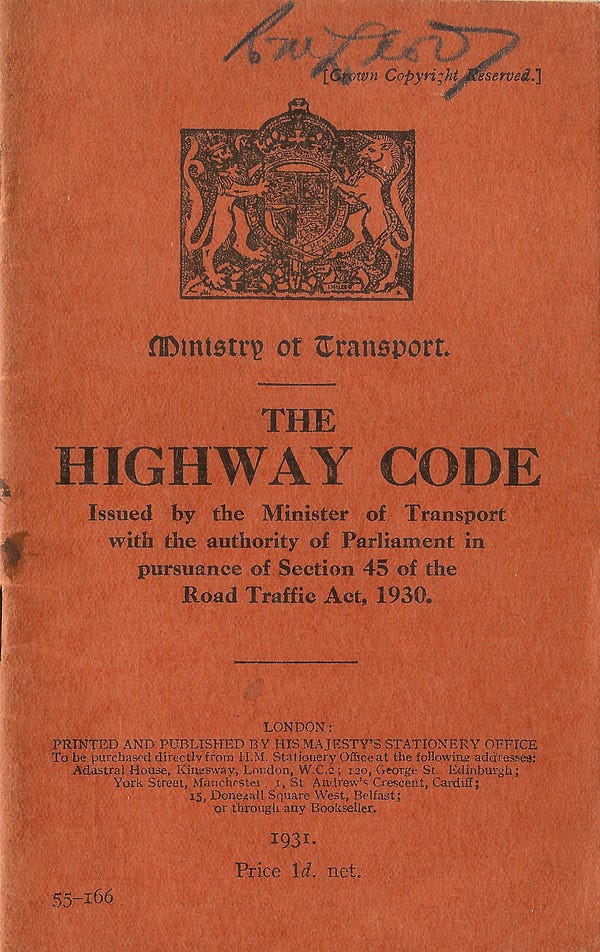
A first edition of the first UK Highway Code by Mikey Ashworth, CC-BY-2.0
The analogy of roads helps break people out of the usual mindset when thinking about data. The frequent comparison with oil is particularly misplaced.
The analogy of roads is much more relevant. The importance of maintenance;the need for big, open roads between large towns and the value of smaller roads for villages; the dangers of toll roads and expensive or complicated licensing; and rulebooks for how to use the roads.
It’s a pretty decent analogy, as analogies go, but my friend had started talking about Roman roads.
Roman roads helped co-opt other economies
Mansio were set up along the roads. They were maintained by the Roman government and used by officials and armies. Officials from the government and their animals could sleep, get washed and get fed. Many other people could use the mansios too but they would have to pay for the privilege.
The money people paid would go to the upkeep of the mansios and to the running of the cursus publicus. The cursus publicus was a transportation system, both for people and for messages. Officials and their information would travel for free. Everyone else would have to pay. It was a massive toll road network set up across a range of nations with preferential access for one group of people.
Other people would pay because the Roman roads were so much better than the roads they could build themselves. There was no real competition: if you wanted to go from A to B you had to go Roman. As a result many of the mansio gradually grew into towns.
A Roman coin showing Marcus Aurelius. Copyright: CC-BY-SA 3.0 by Rasiel at English Wikipedia
After telling me the tale of Roman roads my friend turned to me and said: isn’t that what you just described? Aren’t Google, Microsoft, Amazon and those big government agencies a modern cursus publicus?
Oh, I said, yes they are.
What have the Romans ever done for us
As I noted earlier “data is roads” is just an analogy and IANARH (I am not a Roman historian) but the similarity of the Roman system to our current data infrastructure was both striking and reassuring.
The Roman road system was striking in its similarities, even down to people bemoaning what the road builders have done while using their roads, recognising that what they’ve done is actually very good and realising that in many cases it couldn’t have happened without them.
It was also reassuring. History is full of repeated patterns and perhaps the current stage of evolution of our data infrastructure is a necessary stage in a pattern that repeats when new infrastructure emerges.
We learnt that roads needed to be run as a system
Roman roads might have started off as a form of military and economic conquest but we gradually learnt more about the need for roads to be run as a system for the good of everyone in society. This took a while, as did our understanding of government’s role in making that happen. The case for this involvement evolved as we understood the decisions that needed to be made.
A thousand years after the fall of the Roman empire the UK decided that governments should take a stronger role in roads with the first Highways Act in the UK. 300 years later the Rebecca Riots against toll roads contributed to the gradual removal of charges and the transfer of responsibility to central and local government for maintaining most roads. Private roads, for example the path to your house or the bit of road to a local factory, were not transferred but governments make sure that we have a duty of care to visitors and workers.
But one final thought. Many of the major roads in European countries are still based on the old Roman ones. I wonder if in 2000 years our data infrastructure will still show signs of its 21st century origins and the decisions of the people who are building it now?
If you enjoyed this story, we recommend reading our latest tech stories and trending tech stories. Until next time, don’t take the realities of the world for granted!
Some of those potential issues came up again recently when our family cat, Bugsy, was being transferred to our new home. I was nervous about the cat arriving safe and on time. A friend asked:
can’t you publish some data showing the cat on his journey?
Such a short and simple question. This is my long and complex answer. Most of my friends are patient people.
This post might sound like it is going to be whimsical —ok, there will be some cat whimsy…— but there is a serious point. Publishing and thinking about cat data helped me think and talk about other data things with more people.
Thinking and talking about data protection, ownership and control for cat data will have the same effect. It is pretty important that more people know how complex they are.
Data from which a person can be identified is personal data.
If data can be combined with other information to identify a person, that data will still be personal data.
If there is personal data in a dataset then we should consider relevant data protection legislation and the univeral human right of privacy.
At this point I expect that lots of people reading this post will be thinking that a cat is not a person so neither the personal data definition or human rights do not apply.
Whilst this would be a fascinating topic to explore unfortunately, to paraphrase a recent article by Luciano Floridi on the rights of robots and artificial intelligence, I’m in danger of chasing my own tail when I should be focussing on the current opportunities and challenges with data that affect people. People like me. Our cat wasn’t moving home in a few year’s time, he was moving now; and I was nervous.
There is a simple reason why I need to think about data protection if I was to publish this cat data. Whether cats realise it or not, their data can refer to people. My cat lives in the same house as me. If you knew the destination of its journey then you would know where I live. If you knew the date when it was being transferred to a new home then you might be able to guess that my old or new home is empty. Etcetera.
I occasionally hear people saying that defining a legal right to personal data ownership will make this process easy. My privacy, my data, my choice. I doubt my cat cares about human laws but, according to the law, I own him. So I might legally own data about my cat and would have the legal right to choose to publish it. Unfortunately data ownership is not that simple and nor is cat data.
How is my cat’s identity defined? Some cats have microchips, and Edinburgh University have even given a library card to a cat so it can prove its identity and demonstrate its entitlement to borrow books, but our cat just has a phone number on its collar. Is that sufficient?
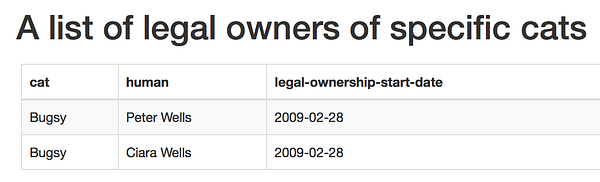
Meanwhile Bugsy is a family cat. He is owned by me and my wife. It might look like that joint ownership can easily be defined in data, but the world is more complex than my simple model. How is my identity and that of my wife defined? How would we verify our identities to say that we are allowed to track our cat on his journey? Identity management is hard.
And once we get past those issues I might find that my wife disagrees on how the cat’s data can be used. We both own and live at the same house that the cat is being transferred to. The data refers to both of us. My wife might think my nervousness is utterly ridiculous and not worth risking our privacy for. There have been severallegaldisputes over the ownership of pets. I don’t think it would calm my cat moving nerves if I was to take my wife to court over ownership of cat data.
Meanwhile we’re still missing something quite important. The cat isn’t travelling alone on his journey. He is being transported by an employee of a company. What about that company’s potential rights to own the data produced by their service? What about the cat transporter’s privacy?
Controlling cat data
At this point, when answering that simple question from a friend about publishing data about Bugsy’s journey to make me feel less nervous, I started to talk more about consent.
Giving people choice and ongoing control over how you use their data is becoming more important. It’s one of Tim Berners-Lees three challenges for the web. Some trading blocks, like the EU, and individual nations, like the UK, have decided that it is necessary to put in place new legislation that strengthen people’s rights over data. Consent is not always necessary but the ICO recently published some draft guidance on consent under that new legislation which I could use to help publish cat data.
My wife knows quite a bit about data so could give informed consent which I could record. I could also ask the cat transporter and their employer if they were willing to consent. To be clear I would want to give the cat transporter the choice of saying no. A world where people who transport cats have less privacy than other people does not sound a sensible world.
And all I would have achieved by this point was possibly gaining consent. I would not have given the cat transporter control over the data about their journey. With that control they could reuse the data for another purpose, such as reclaiming their petrol costs or seeing what cat data tells us about people moving house around the country. My wife, the cat transporter, their employer and I all had rights to the cat data and should all be able to have some control over its use.
Sometimes you need to keep things simple
At this point my wife and friend both firmly interrupted me and told me I was not being utterly ridiculous but being completely and utterly ridiculous. I was trying to design a perfect solution that would work for many cats and purposes, rather than keeping things simple and starting with a solution for a particular problem. My nervousness about our cat.
My wife rang the cat transportation company and asked them to text us a couple of times during the journey. They agreed, of course. Sensible wife.
Data is complex, and that’s ok
Now you might read all of this and ask:
if we have to think through all of this complexity everytime we’re thinking of publishing data how will we ever build anything?
The team at the Open Data Institute, where I work, do the hard work to try and make data as simple and easy as possible so more organisations can get data to people who need it.
But sometimes I wonder if we and other people can make it sound too easy.
So when we’re encouraging more people to do wonderful things with data then as well as the brilliant possibilities we also talk about the challenges using both real examples and whimsical ones like the ones I faced with my cat data. Whimsical tales sometimes help convey simple messages.
We can build a better future with data but we need to solve problems and be realistic about the complexity if we are to build one that works for people. Data is complex, and that’s ok.
Hello. This is the personal website of Peter K Wells. I do politics, policy and delivery to try to make data and technology benefit everyone. I also do bad jokes and music references.
This website stores cookies on your computer. These cookies are used to provide a more personalized experience and to track your whereabouts around our website in compliance with the European General Data Protection Regulation. If you decide to to opt-out of any future tracking, a cookie will be setup in your browser to remember this choice for one year.